AMD Radeon RX Vega 64 vs AMD Radeon RX 5500 XT: real performance and FPS — which is better? Full comparison
Detailed gaming performance comparison
Reference CPU: Intel Core i5-13400
We compare the RX Vega 64 and the RX 5500 XT with real FPS across the most popular games at 1080p, 1440p and 4K, plus specs, launch price and AI upscaling support (DLSS/FSR/XeSS). See at a glance which is better for your resolution and budget.
The RX Vega 64 is ~4% faster than the RX 5500 XT on average at 1080p. On top of that, the RX 5500 XT is 60% cheaper (launch price).
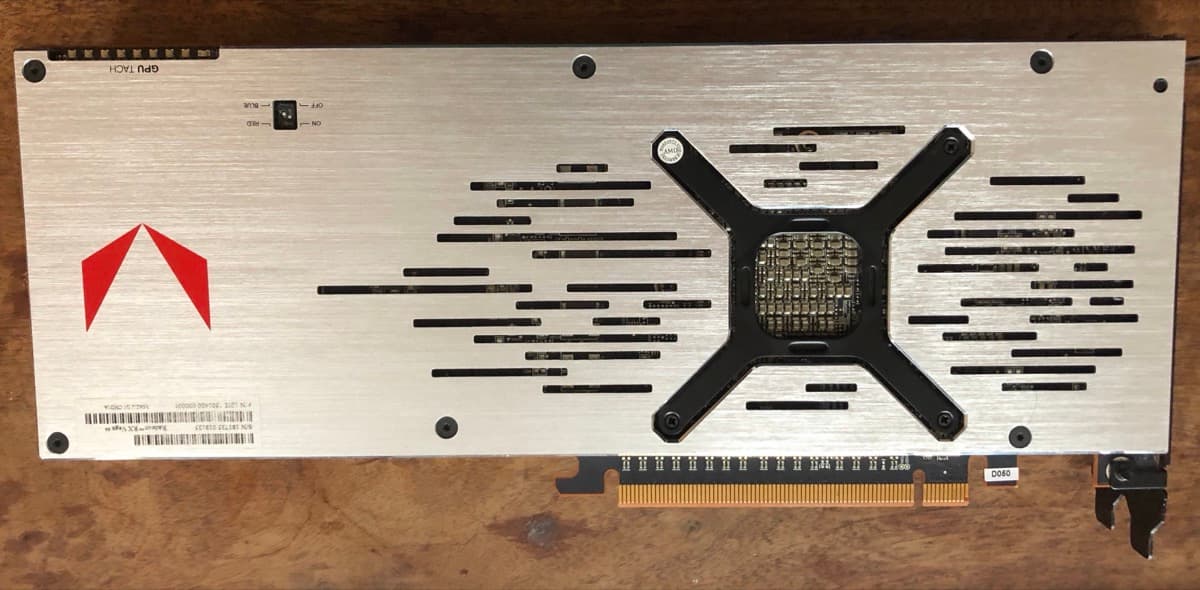
RX Vega 64
- Index (1080p)
- 25/100
- VRAM
- 8 GB
- Price (MSRP)
- $499 · ≈ €459
- $/FPS (value)
- $19.19 · ≈ €17.66
- Upscaling
- FSR

RX 5500 XT
- Index (1080p)
- 24/100
- VRAM
- 8 GB
- Price (MSRP)
- $199 · ≈ €183
- $/FPS (value)
- $7.96 · ≈ €7.32
- Upscaling
- FSR
Average FPS by resolution
Estimated average FPS for each graphics card across the most popular games. The gap usually shows at 1080p and 1440p; at 4K both lose smoothness and upscaling (DLSS/FSR) helps.
| Resolution | RX Vega 64 | RX 5500 XT | Difference |
|---|---|---|---|
| 1080p | 26 | 25 | +4% |
| 1440p | 17 | 16 | +6% |
| 4K | 7 | 6 | +17% |
Which one for your resolution?
RX Vega 64 is the best pick at all three resolutions, averaging 9% more FPS.
Specifications
Side-by-side specs of the RX Vega 64 and RX 5500 XT: VRAM, power draw (TDP), performance index and launch price. The better value in each row is highlighted in blue.
| Spec | RX Vega 64 | RX 5500 XT |
|---|---|---|
| Brand | AMD | AMD |
| VRAM | 8 GB | 8 GB |
| TDP | 295W | 130W |
| Tier | High-end | Entry-level |
| Score 1080p | 25 | 24 |
| Score 1440p | 19 | 17 |
| Score 4K | 10 | 8 |
| Price (MSRP) | $499 | $199 |
| Architecture | Vega | RDNA 1 |
| Process Node | GlobalFoundries 14nm | TSMC 7nm |
| Shading Units (CUDA/Stream) | 4096 | 1408 |
| RT Cores | — | — |
| Texture Units (TMUs) | 256 | 88 |
| ROPs | 64 | 32 |
| Base Clock | 1247 MHz | 1607 MHz |
| Boost Clock | 1546 MHz | 1845 MHz |
| FP32 Performance (Teraflops) | 12.66 TFLOPS | 5.2 TFLOPS |
| Memory Type | HBM2 | GDDR6 |
| Memory Clock | 945 MHz | 14000 MHz |
| Memory Bus | 2048-bit | 128-bit |
| Memory Bandwidth | 484 GB/s | 224 GB/s |
| PCIe Version | PCIe 3.0 | PCIe 4.0 |
| Transistor Count | 12.5B | 6.4B |
| Release Date | 2017-08-07 | 2019-12-12 |
Power & efficiency
TDP doesn't tell the whole story: here's how much each GPU delivers per watt it draws.
RX Vega 64
- TDP
- 295W
- FPS/W
- 0.09
RX 5500 XT
- TDP
- 130W
- FPS/W
- 0.19
The RX 5500 XT is more efficient: it draws 165W less and delivers more per watt, though the RX Vega 64 is still the faster card overall.
What FPS do these GPUs get in your game?
Pick the GPU and the game, and we'll take you straight to its real FPS.
Pick the GPU
Gaming Performance
Per-game FPS detail at 1080p Ultra. The graphics card that wins each title is highlighted in blue.
| Game | RX Vega 64 | RX 5500 XT | Winner |
|---|---|---|---|
 | 29 | 28 | RX Vega 64 |
 | 27 | 26 | RX Vega 64 |
 | 21 | 21 | Tie |
 | 23 | 22 | RX Vega 64 |
 | 23 | 23 | Tie |
| 22 | 21 | RX Vega 64 | |
 | 28 | 27 | RX Vega 64 |
 | 29 | 28 | RX Vega 64 |
 | 32 | 31 | RX Vega 64 |
 | 26 | 25 | RX Vega 64 |

Verdict
AMD Radeon RX Vega 64 wins in 8 out of 10 games
At CheckFPS we measured both cards across 10 popular games at 1080p, 1440p and 4K on a reference CPU. The RX Vega 64 comes out ahead by around 4% more FPS on average, and that lead holds up as resolution climbs. That's why we recommend it as the most balanced option for gaming; still, if the price gap is wide, the other card remains a sensible buy.
Frequently asked questions
Common questions when comparing the RX Vega 64 with the RX 5500 XT.
Which is better, the RX Vega 64 or the RX 5500 XT?
On average at 1080p, the RX Vega 64 is 4% faster than the RX 5500 XT. The best one for you depends on your resolution, budget and whether you prioritise ray tracing or price.
Which is better at 4K?
At 4K Ultra, the RX Vega 64 averages 7 FPS and the RX 5500 XT 6 FPS across the most popular games. For smooth 4K, enabling upscaling (DLSS/FSR) helps on both.
Is it worth paying more for the faster one?
At 1080p or 1440p the FPS gap may not justify the extra cost; at 4K or with ray tracing the faster card matters more. Check the by-resolution table to decide.
Which has better ray tracing and upscaling?
AI upscaling (DLSS on NVIDIA, FSR on AMD, XeSS on Intel) raises FPS on both; for ray tracing, GeForce RTX cards usually lead. See each card’s support above.
How big is the FPS difference between them?
On average across top games, the gap is around 4% at 1080p. At higher resolutions (1440p and 4K) the relative difference usually stays similar.
Vega 64 vs 5500 XT: what's the real difference?
In performance, the RX Vega 64 beats the RX 5500 XT by around 4% more FPS on average at 1080p — the gap shifts a bit by resolution, as shown in the table above. If you're torn between the Vega 64 and the 5500 XT on price, the price and $/FPS section above can help you decide.