
How Many FPS Does Schedule I Get with RX 7900 XTX? Performance at 1080p, 1440p & 4K
 Affiliate link
Don't have Schedule I yet?
Get it cheaper with an official key on Eneba.
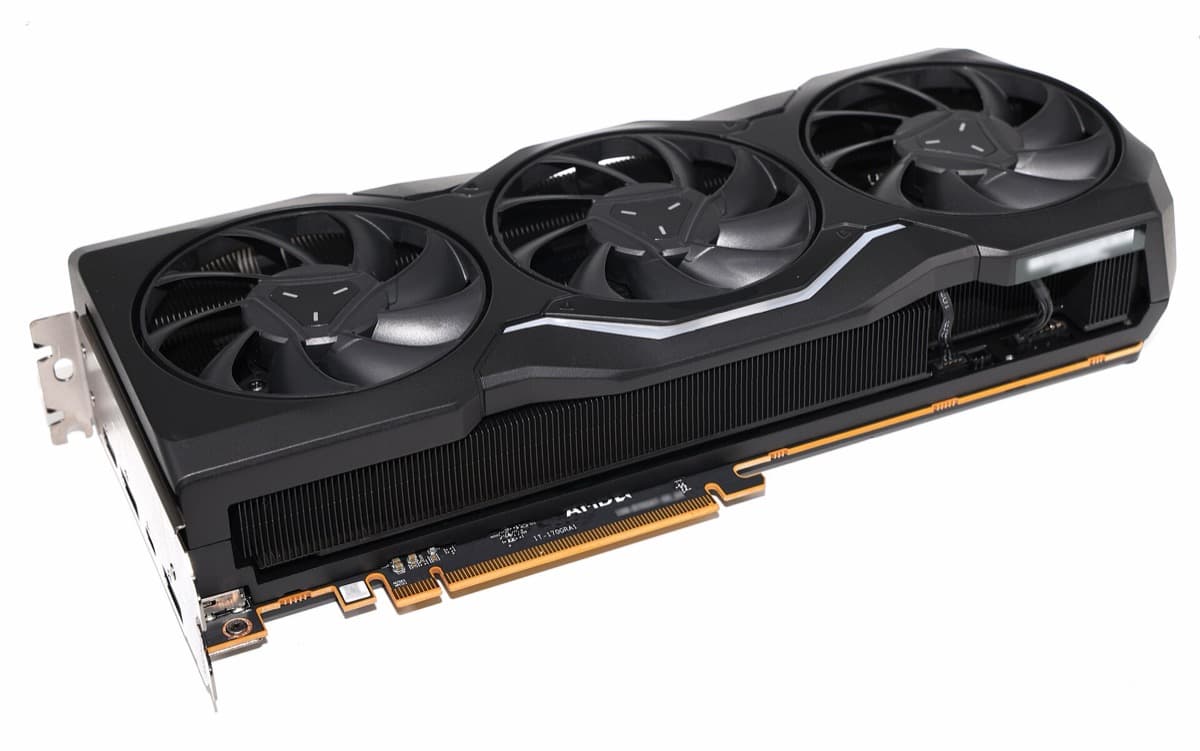
Want the RX 7900 XTX at the best price?
Check the current price on Amazon.
Schedule I system requirements
Official minimum and recommended requirements published by the developer.
Minimum
Recommended
Game keys on saleUpcoming games, cheaper with an official key.

Assassin's Creed Black Flag Resynced
View on Eneba →

Halo: Campaign Evolved
View on Eneba →

Beast of Reincarnation
View on Eneba →

The Sinking City 2
View on Eneba →

Resonance: A Plague Tale Legacy
View on Eneba →

Star Wars Zero Company
View on Eneba →

The Blood of Dawnwalker
View on Eneba →

Halloween: The Game
View on Eneba →

Warhammer 40,000: Dawn of War IV
View on Eneba →

Silent Hill: Townfall
View on Eneba →

Control Resonant
View on Eneba →

Ace Combat 8: Wings of Theve
View on Eneba →

Gears of War: E-Day
View on Eneba →
Affiliate link
RX 7900 XTX Specifications
These are the basic specs. The full RX 7900 XTX page adds the rest of the technical data and its FPS game by game, not just in Schedule I.
Want the exact Schedule I FPS with your RX 7900 XTX?
These FPS assume a reference CPU. Add your real processor and RAM and we'll tailor the estimate to your rig.
- Estimate tailored to your rig
- Customize resolution, quality, and RAM
Schedule I benchmark on RX 7900 XTX: FPS by resolution and quality
Pick yours and we recalculate the whole table above with it.

Schedule I FPS with a RX 7900 XTX and a Intel Core i5-13400
| Quality | 1080p (Full HD) | 1440p (2K) | 4K (Ultra HD) |
|---|---|---|---|
| Ultra | 327FPS min 159Excellent | 281FPS min 145Excellent | 195FPS min 118Excellent |
| High | 425FPS min 207Excellent | 366FPS min 189Excellent | 253FPS min 153Excellent |
| Medium | 500FPS min 244Excellent | 478FPS min 247Excellent | 331FPS min 200Excellent |
| Low | 500FPS min 244Excellent | 500FPS min 258Excellent | 428FPS min 258Excellent |
| Bottleneck (estimated) | CPU 66% | CPU 61% | CPU 46% |
The percentage estimates how much of the stronger component's capability goes unused because of the other one.
This one does matter: from the Intel Core i9-14900K downwards the processor becomes the brake on the RX 7900 XTX. There is 6% between the slowest and fastest CPU in the table. One caveat: this is at 1080p, where the CPU weighs most. At 1440p and 4K the graphics card takes over and the processor stops mattering.
FSR performance: FPS with AI upscaling
Upscaling renders Schedule I at a lower internal resolution and reconstructs the image, so you trade a little sharpness for extra frames. These are the estimated figures for the RX 7900 XTX with FSR enabled, starting from its native Ultra FPS.
| Resolution | Native | FSR Quality | FSR Performance | + Frame generation |
|---|---|---|---|---|
| 1080p | 327 | 409 | 474 | 695 |
| 1440p | 281 | 379 | 464 | 644 |
| 4K | 195 | 283 | 361 | 481 |
Frame generation inserts intermediate frames: it raises the smoothness you see on screen, but it does not reduce input latency, so use it selectively in competitive games.
About ray tracing: every figure on this page is with ray tracing off. The RX 7900 XTX does have dedicated hardware for it, so you can turn it on in games that implement it. The FPS cost swings widely depending on how much ray tracing each title uses, and FSR is exactly what people lean on to pay for it.
Estimated figures. The real gain varies by game and by the version of the technology.
Is the CPU or the graphics card holding you back?
These FPS assume a mid-range CPU that isn't a bottleneck — roughly a Intel Core i5-13400 — and 16 GB of RAM.
With that CPU, the RX 7900 XTX has headroom to spare in Schedule I: the processor runs out before the graphics card does. A faster processor would gain you FPS; a stronger graphics card would barely help.

Is the RX 7900 XTX Enough for Schedule I?
The RX 7900 XTX delivers 327 FPS at 1080p Ultra in Schedule I. More than enough for 144Hz. You can comfortably play at 1440p.
At 1440p it gets 281 FPS and at 4K 195 FPS at Ultra quality.
This GPU is more than enough — you can play at 1440p or 4K comfortably
Want more FPS in Schedule I?
Our guide collects the settings that give between +40% and +90% FPS in Schedule I with barely any visual loss. Recommended settings, GPU-specific tips (NVIDIA/AMD/Intel) and solutions to common game issues.
RX 7900 XTX or RTX 5090 Laptop for Schedule I?
In Schedule I at 1080p Ultra both land on the same figure: 327 FPS. Price and power draw are what separate them.
RX 7900 XTX vs RTX 5090 Laptop: which one is faster?Other GPUs for Schedule I
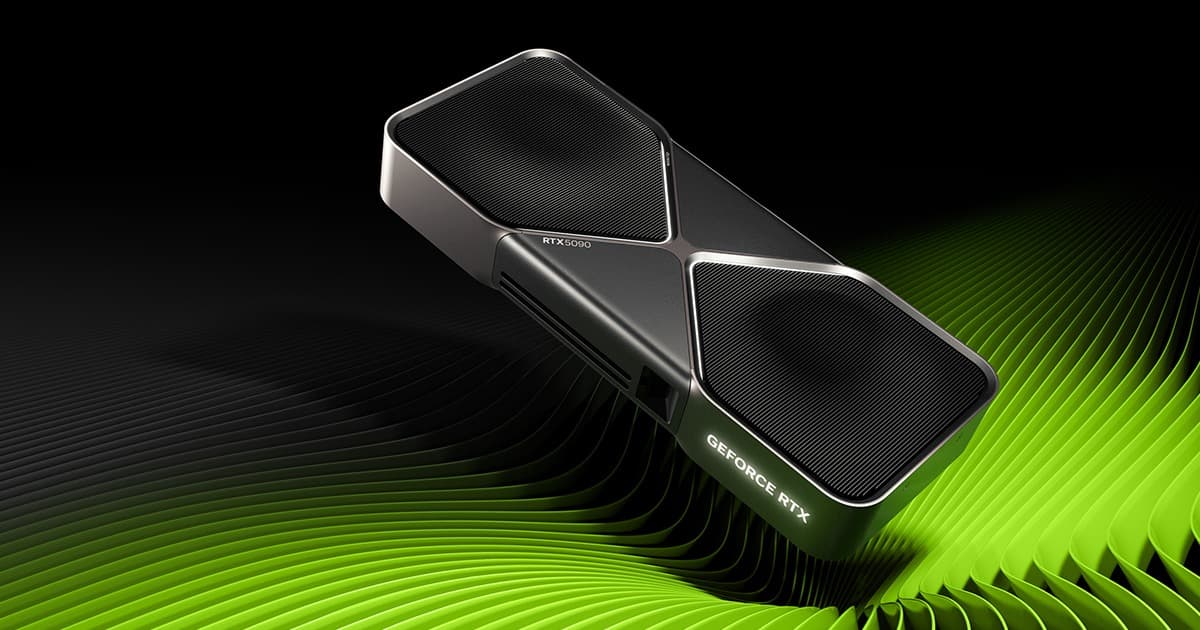
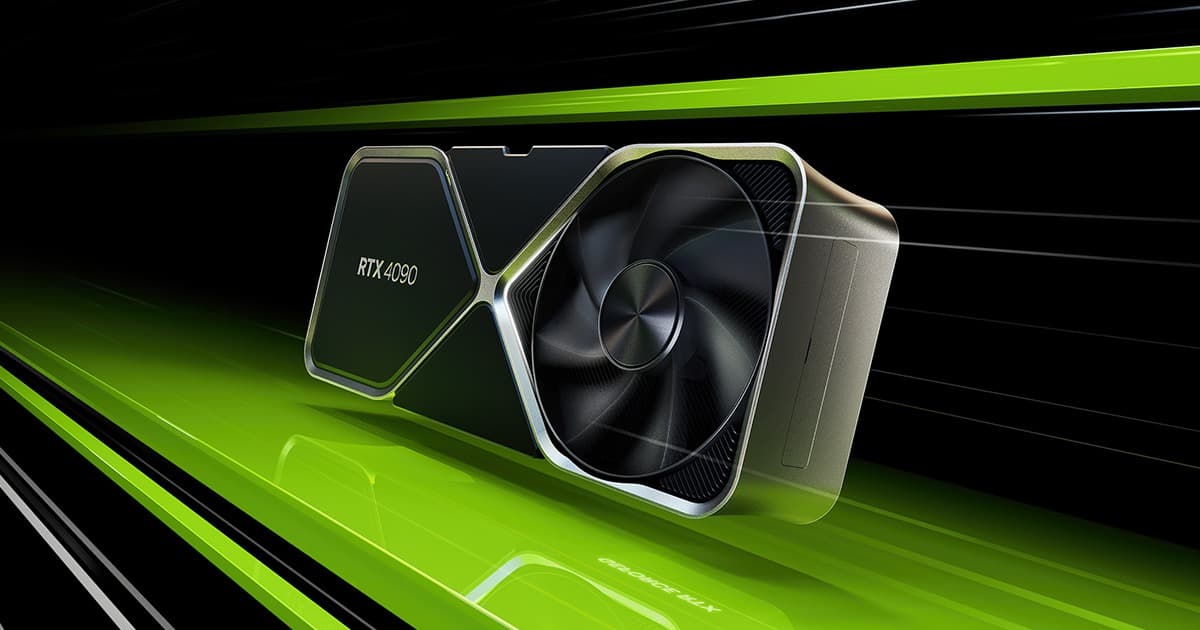
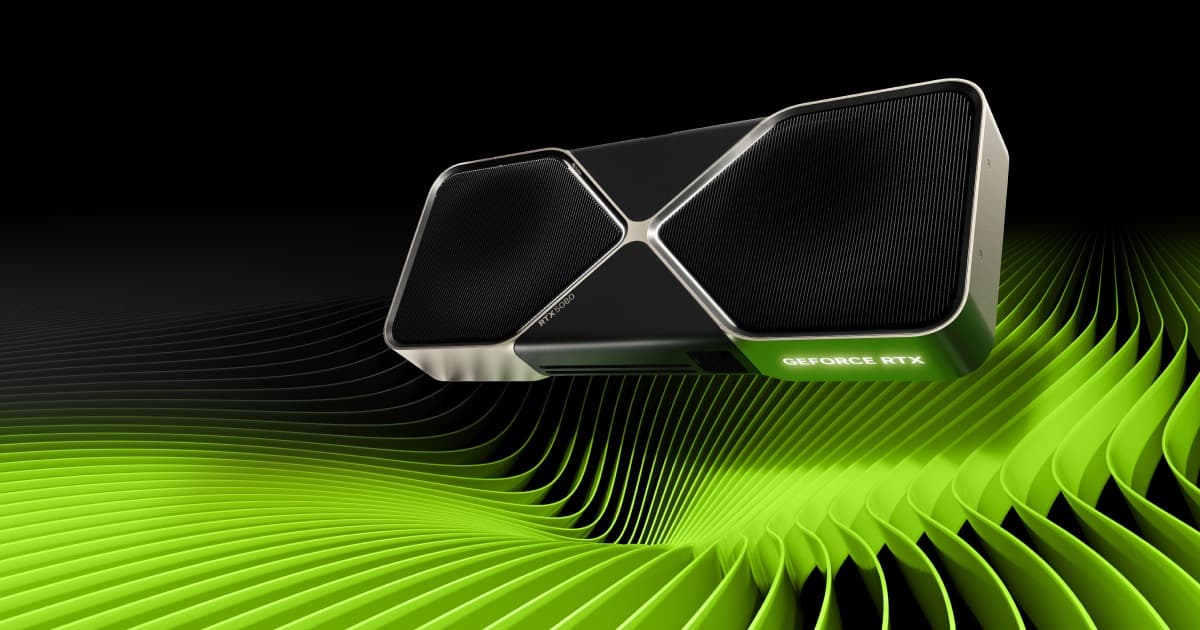
If none of these convinces you for Schedule I, the full ranking sorts all 143 cards by real FPS, not synthetic scores.
See the full graphics card ranking by real FPS


